 Contact
 Hoe winkelen bij ons werkt
Bezorging
Winkelgids
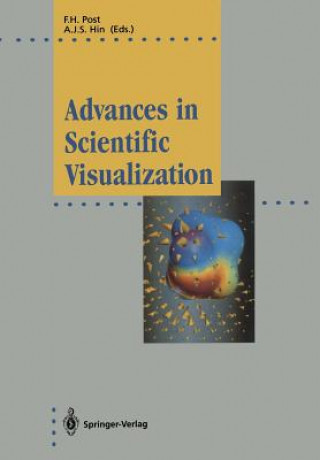
Advances in Scientific Visualization
 Engels
 249 b
249 b
Tot 30 dagen retourrecht
Klanten kochten ook

 /
/
 Gebonden (paperback)
 39.17
€
39.17
€


Scientific visualization is a new and rapidly growing area§in which efforts from computer graphics research and many§scientific and engineering disciplines are integrated. Its§aim is to enhance interpretation and understanding by§scientists of large amounts of data from measurements or§complex computer simulations, using computer generated§images and animation sequences. It exploits the power of§human visual perception to identify trends and structures,§and recognize shapes and patterns. Development of new§numerical simulation methods in many areas increasingly§depends on visualization as an effective way to obtain an§intuitive understanding of a problem.§This book contains a selection of papers presented at the§second Eurographics workshop on Visualization in Scientific§Computing, held in Delft, the Netherlands, in April 1991.§Theissues addressed are visualization tool and system§design, new presentation techniques for volume data and§vector fields, and numerous case studies in scientific§visualization. Application areas include geology, medicine,§fluid dynamics, molecular science, and environmental§protection.§The book will interest researchers and students in computer§graphics and scientists from many disciplines interested in§recent results in visual data analysis and presentation. It§reflects the state of the art in visualization research§and shows a wide variety of experimental systems and§imaginative applications.


Informatie over het boek
Engels
Categorieën

Geef dit boek vandaag nog cadeau
Dat gaat heel eenvoudig
1 Voeg het boek toe aan je winkelwagentje en selecteer Als cadeau bezorgen 2 Je krijgt van ons per omgaand een voucher 3 Het boek wordt bezorgd op het adres van de ontvangerDit vind je misschien ook interessant
 /
Gebonden (paperback)
51.59
€
/
Gebonden (paperback)
51.59
€


Hoi! Ik ben Libroamiko, je boekadviseur.
Hoe kan ik je helpen?